the Creative Commons Attribution 4.0 License.
the Creative Commons Attribution 4.0 License.
 | 24 Jan 2020
Electron spin resonance (ESR) thermochronometry of the Hida range of the Japanese Alps: validation and future potential
Georgina E. King
Sumiko Tsukamoto
Frédéric Herman
Rabiul H. Biswas
Shigeru Sueoka
Takahiro Tagami
The electron spin resonance (ESR) of quartz has previously been shown to have potential for determining rock cooling histories; however, this technique remains underdeveloped. In this study, we explore the ESR of a suite of samples from the Hida range of the Japanese Alps. We develop measurement protocols and models to constrain the natural trapped-charge concentration as well as the parameters that govern signal growth and signal thermal decay. The thermal stability of the Al and Ti centres is similar to that of the luminescence of feldspar. Inverting the ESR data for cooling yields similar thermal histories to paired luminescence data from the same samples. However, a series of synthetic inversions shows that whereas the luminescence of feldspar can only resolve minimum cooling histories of ∼160 ∘C Myr−1 over timescales of 103−5 years, quartz ESR may resolve cooling histories as low as 25–50 ∘C Myr−1 over timescales of 103−7 years. This difference arises because quartz ESR has a higher dating limit than the luminescence of feldspar. These results imply that quartz ESR will be widely applicable in the constraint of late-stage rock cooling histories, providing new insights into landscape evolution over late Quaternary timescales.
- Article
(8879 KB) - Full-text XML
-
Supplement
(4362 KB) - BibTeX
- EndNote


Thermochronometry based on trapped-charge dating allows for the constraint of late-stage exhumation and/or rock thermal histories at the scale of glacial–interglacial cycles (e.g. Biswas et al., 2018). Following the study of Herman et al. (2010), which applied optically stimulated luminescence (OSL) dating to constrain the exhumation histories of the Southern Alps of New Zealand, there have been a number of both methodological and applied studies that have almost exclusively focused on luminescence dating (see King et al., 2016a; Herman and King, 2018, for reviews). In this study we explore the potential of a second trapped-charge dating method, the electron spin resonance (ESR) of quartz, for ultra-low-temperature (i.e. <100 ∘C) thermochronometry.
Electron spin resonance can be used to measure the time-dependent accumulation of unpaired electrons (paramagnetic centres) in minerals such as quartz (see Grün, 1989; Ikeya, 1993). As for luminescence dating, when a mineral is exposed to ionizing radiation, electrons are excited from their ground state in the valence band to the conduction band. Almost immediately most electrons fall back to the valence band, recombining with the “holes” of positive charge created by the electron's excitation. However, some electrons become trapped within defects in the crystal lattice, caused by element vacancies or substitutions. In this study we specifically target the Al (hole trapping) centre and the Ti (electron trapping) centre, although other defects such as the E' (oxygen vacancy) centre could also be investigated (e.g. Grün et al., 1999). The Al centre comprises a hole located at AlO− (Nuttall and Weil, 1981), whereas the Ti centre comprises the substitution of Si4+ with stabilized with H+, Li+, or Na+ (Rinneberg and Weil, 1972; Isoya et al., 1983). ESR offers a key advantage over luminescence dating, specifically that ESR signals saturate at higher doses (Rink, 1997; Tsukamoto et al., 2018). Within the context of thermochronometry, this means that whilst the application of luminescence thermochronometry remains geographically limited to regions experiencing extremely rapid cooling, i.e. exhumation, higher than several millimetres per year, e.g. New Zealand (Herman et al., 2010) and the eastern Himalayan syntaxis (King et al., 2016b), ESR thermochronometry could be much more widely applied.
The potential of ESR for thermochronometry has been recognized previously. Following from an earlier study (Ikeya, 1983), Toyoda and Ikeya (1991) first suggested that the intensity of quartz ESR centres could be used to determine the low-temperature thermal histories of the host rock. Scherer et al. (1993, 1994) investigated changing ESR centre intensities with depth through the known-thermal-history KTB borehole in Germany (Coyle et al., 1997), which has also been used to validate the luminescence thermochronometry technique (Guralnik et al., 2015; Biswas et al., 2018). Scherer et al. (1993, 1994) recorded a qualitative reduction in the signal intensity of the Al centre with increasing temperature and depth. In contrast, data for the Ti centre were much more scattered, with zero signal intensity recorded for many samples. However, it was Grün et al. (1999) who reported the first quantitative ESR thermochronometry results from their study of the Eldzhurtinskiy granite from the Russian Caucasus. Using the Al and Ti centres of quartz, they obtained cooling rates between 160 and 600 ∘C Myr−1, which correspond to denudation rates of ∼2.5 and 5.5 mm yr−1.
Despite the potential illustrated by ESR thermochronometry in these early studies, the technique has not been applied since, in part associated with the difficulties of making ESR measurements (i.e. gamma or X-ray source availability, absence of automated instrumentation). In this study, we investigate the potential of ESR thermochronometry by applying new measurement protocols (Tsukamoto et al., 2015), which have been facilitated by developments in instrumentation (Oppermann and Tsukamoto, 2015) and that have recently been validated against samples with independent age control (Richter et al., 2019). We propose a kinetic model inspired by recent progress in luminescence thermochronometry (Lambert, 2018) to facilitate the inference of rock thermal histories from ESR laboratory data and perform a series of synthetic inversions to evaluate the range of cooling histories that ESR thermochronometry may be applicable over. We then investigate six rock samples from the Japanese Alps and contrast their ESR thermal histories with those obtained from optically stimulated luminescence thermochronometry of feldspar (e.g. Guralnik et al., 2015; King et al., 2016b, c) for the same samples.
The theoretical basis of ESR thermochronometry is very similar to that of luminescence thermochronometry (see King et al., 2016a; Herman and King, 2018 for reviews), with the advantage that unlike feldspar minerals, quartz minerals are not thought to suffer from athermal signal losses. Here we present the kinetic model for ESR thermochronometry, before discussing how the parameters that describe signal growth and signal thermal decay can be constrained in the laboratory.
2.1 Kinetic model
We propose the following kinetic models to describe the evolution of ESR signals with temperature. A saturating system may be described by
and a non-saturating system can be described by
where
and
Here, is the trapped-charge population with activation energy, Ea (eV). In the instance of a saturating system is expressed as a saturation ratio, but for a non-saturating system it is expressed as absorbed radiation dose (Gy). The first term on the right-hand side of Eqs. (1) and (2) describes charge trapping as a 1st-order process. For a non-saturating system, is defined by the environmental dose rate (Gy), whereas for a saturating system, is defined as , where D0 is the characteristic dose of saturation (Gy). The second term on the right-hand side of Eqs. (1) and (2) describes thermal charge detrapping, and here we benefit from recent advances made in luminescence thermochronometry and follow Lambert (2018) by describing thermal detrapping using a model that assumes a Gaussian distribution of activation energies, σ(Et), around the mean trap depth, μ(Et) (eV). Thermal detrapping is also described by the frequency factor s (s−1), the Boltzmann constant kB (eV), temperature T (K), and P(Ea) – the probability of thermally evicting electrons (or holes) from the trap (Eq. 4). An alternative approach could be to use a 1st- or 2nd-order kinetic model as has been done previously (Toyoda and Ikeya, 1991; Ikeya, 1993; Grün et al., 1999), and we discuss our model selection more completely in the Supplement.
2.2 Constraining charge trapping
The natural trapped-charge concentration, which reflects the equilibrium between charge trapping and thermally stimulated charge detrapping, can be measured in the laboratory through the development of a sample-specific radiation dose response curve. This comprises measurement of a sample following increasingly large laboratory radiation doses and interpolation of the natural ESR signal onto the resultant dose response curve. Measurements can either be made on single aliquots (e.g. Tsukamoto et al., 2015) or using multiple aliquots of the same sample (e.g. Grün et al., 1999). The former approach has only recently been made practical, following the introduction of X-ray irradiation for regenerative dosing (Oppermann and Tsukamoto, 2015), as opposed to gamma irradiation, which is often done at a laboratory separate from the measurement laboratory.
2.3 Constraining charge detrapping
Thermal detrapping can be measured following laboratory isothermal decay experiments, whereby aliquots of a sample are given a radiation dose before being heated at different temperatures for different durations. The resultant signal loss is measured and fitted with the kinetic model described in Eqs. (1)–(4). Previous investigations have suggested that the thermal decay of quartz ESR can be described by 1st-order or 2nd-order kinetics. Here, instead we use a density of states model, originally developed for the luminescence of feldspar (Li and Li, 2013; Lambert, 2018; further details of model selection are given in the Supplement). The selected model is based on a Gaussian distribution of activation energies σ(Et) around the mean trap depth, μ(Et) (Lambert, 2018), and may be applicable for quartz ESR data whereby electrons can be trapped in a variety of different defects, e.g. charge compensated for by H+, Li+, or Na+ (Tsukamoto et al., 2018).
Electron spin resonance dating analyses are not automated, meaning that the laboratory measurements required for ESR thermochronometry analyses are considerably more time-consuming than those required for luminescence thermochronometry. It is thus necessary to verify that ESR thermochronometry offers advantages over luminescence methods. To achieve this, a series of synthetic tests for known cooling histories was done using the kinetic parameters of sample KRG16-06 (Table 1). These tests first comprised running a forward model, which uses sample-specific kinetic parameters and a rate equation to describe signal growth. Through forward modelling, it is possible to predict the trapped-charge concentration for a particular cooling history. The second stage of the test comprised inverting the trapped-charge concentrations predicted by the forward model, using the same rate equation, to determine if it is possible to recover the cooling history used in the forward model prediction. Further details of the forward and inverse modelling are given below.
3.1 Forward modelling
Five different monotonic cooling scenarios were used to test the potential of ESR thermochronometry in comparison to OSL thermochronometry, comprising cooling with rates of 100, 75, 50, and 25 ∘C Myr−1, as well as no cooling (i.e. isothermal holding at 0 ∘C for 2 Myr). All cooling rates were maintained for at least 2 Myr with a starting temperature of 200 ∘C, which is greater than the anticipated closure temperature of the ESR system (see Grün et al., 1999; Scherer et al., 1993, 1994). Using the kinetic model in Eqs. (1) and (2), a trapped-charge population, , was predicted for both the Ti and Al centres, respectively, using the kinetic parameters of sample KRG16-06 (Table 1) for the five different scenarios. In addition, the same exercise was carried out for four feldspar multi-OSL thermochronometry signals of the same sample using the following kinetic model after King et al. (2016a) (see the Supplement for further details on model selection):
where the total accumulation of charge with time, i.e. , is obtained by integrating over the range of band-tail states, Eb, and an infinite range of dimensionless distances,
where P(Eb) is the probability of evicting electrons into band-tail states of energy Eb+dEb, defined as
where B is a pre-exponential multiplier and where p(r′) is the probability density distribution of the nearest recombination centre defined by Huntley (2006) as
where dimensionless distance , the dimensionless density of recombination centres , and α is a constant related to the Bohr radius of the electron trap (Huntley, 2006; Kars et al., 2008; Tachiya and Mozumder, 1974).
Table 1ESR centre kinetic parameters, De values, and ages. Maximum ages are calculated from Full details on the environmental dose rate derivation are given in the Supplement.
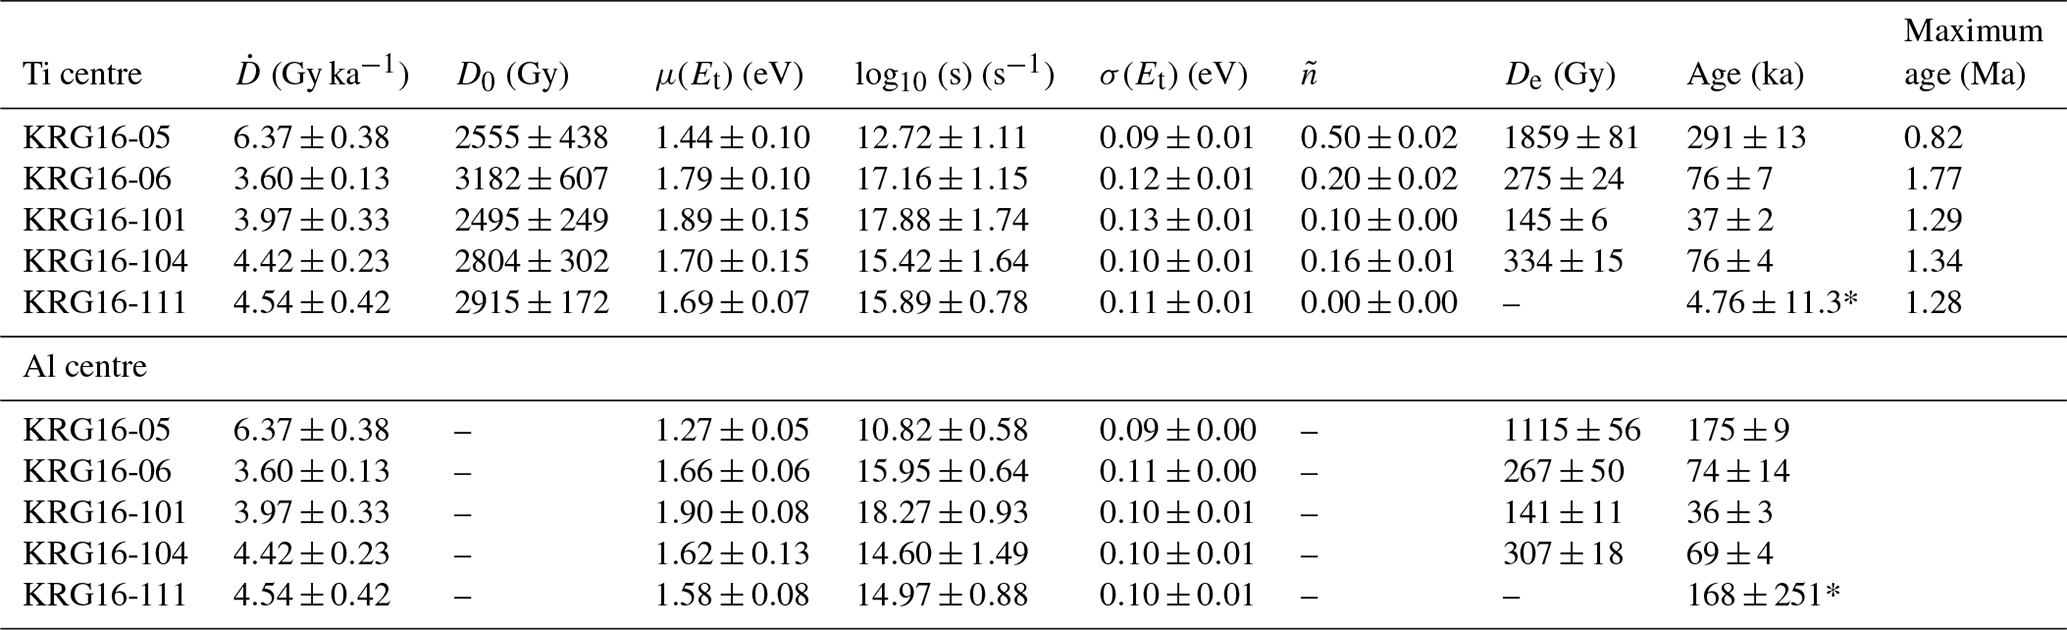
* Ages calculated from a single-aliquot additive dose response curve.
3.2 Inverse modelling
We inverted the five sets of values for the ESR and OSL data described above using a similar approach to King et al. (2016a), which we briefly outline here. The trapped-charge populations were modelled for 10 000 randomly generated time–temperature histories (t–T paths), which were constrained to cool monotonically between 200 ∘C and 0±5 ∘C over 2 Myr. We computed the dose response curves by solving the differential equations described above using a semi-implicit Euler method (Press, 2007). For each t−T path we calculated a misfit between the final inverted trapped-charge population, , and our forward-modelled values, (Wheelock et al., 2015), from which the misfit M and likelihood L are calculated.
This is for m traps, where σ is the uncertainty. An arbitrary uncertainty on of 10 % was assumed. Cooling histories are then accepted or rejected by contrasting L with a random number between 0 and 1; if L is greater, the cooling history is retained. The accepted cooling histories are finally combined to construct a time–temperature history probability density function by dividing the time–temperature axis into 50 intervals and summing the number of paths that cross through each of the different cells. The Al, Ti, and OSL data were first inverted separately and then the Al and Ti centres were inverted together.
The results of the forward modelling and the synthetic inversions for the ESR and OSL data are shown in Fig. 1. The OSL signals for all cooling histories reach saturation (Fig. 1c), and this is reflected in the failure of the OSL to recover any of the cooling histories when inverted. This is apparent because the 1σ confidence intervals show a broad range, with the highest density of cooling histories concentrated at temperatures <20 ∘C over the past 500 kyr, indicating that the luminescence signals are saturated (as shown in Fig. 1c). The minimum cooling rate that can be resolved using OSL for sample KRG16-06 is ∼160 ∘C Myr−1, calculated from 86 % of the luminescence signal saturation level. Signal saturation is the key limitation that restricts the application of luminescence thermochronometry to regions undergoing rapid exhumation. In contrast, it is clear that the ESR data are able to resolve the 100, 75, and 50 ∘C Myr−1 synthetic cooling histories, and cooling rates of 25 ∘C Myr−1 are distinct from isothermal holding at 0 ∘C over timescales of ∼2 Myr. This is apparent because of the coincidence between the prescribed cooling histories (white lines) and the highest density of accepted cooling histories shown by the brightest colours in the probability density functions. These results are significant as they show that ESR thermochronometry is applicable in a range of geological settings beyond the rapidly exhuming locations that luminescence thermochronometry is currently restricted to.
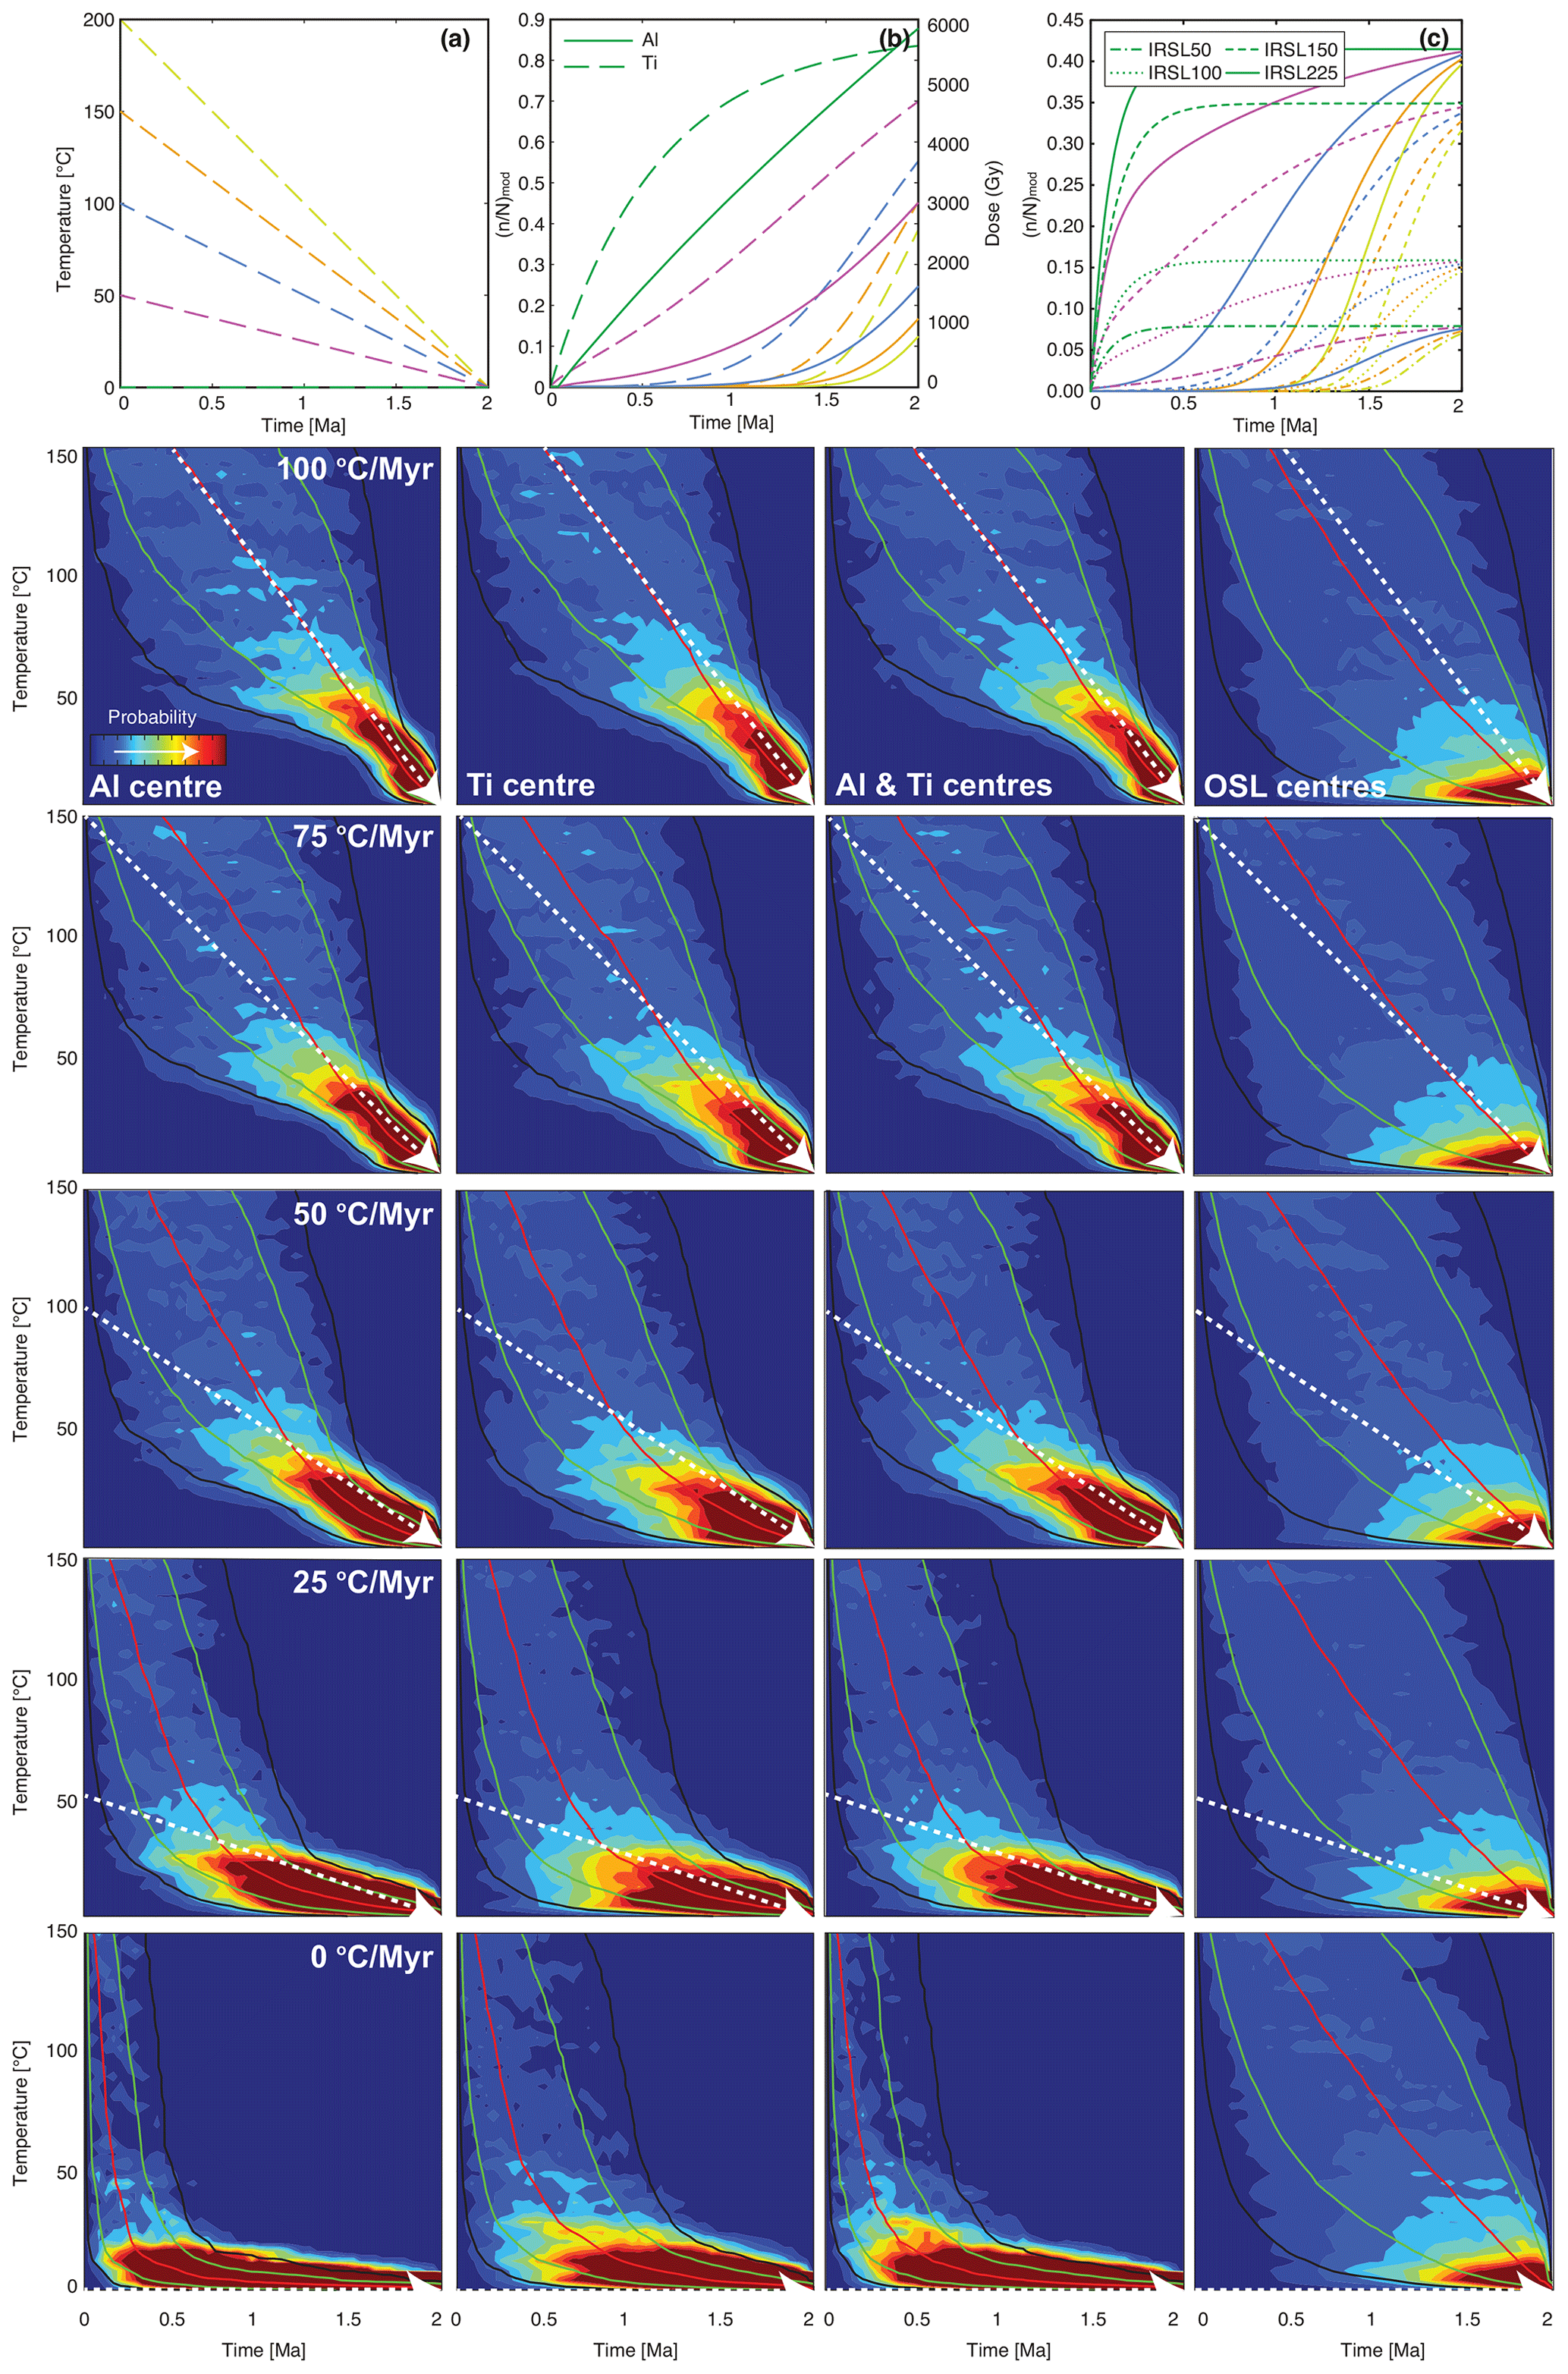
Figure 1Synthetic inversions of ESR and OSL data for monotonic cooling of 100, 75, 50, and 25 ∘C Myr−1, as well as no cooling. (a) Cooling histories and (b) forward-modelled Ti (primary y axis) and Al (secondary y axis) centre signal accumulation, (c) OSL centre signal accumulation. ESR and OSL signals after 2 Myr were then inverted to derive cooling histories for the Al, Ti, and OSL centres, as well as for the Al and Ti centres combined for the different cooling scenarios. The original cooling history from (a) is shown as a white dashed arrow in each of the cooling histories, whilst the 1σ, 2σ, and median cooling histories are shown in green, black, and red, respectively.
To further explore the potential of the ESR method we applied it to a suite of samples from the Hida range of the Japanese Alps. The Japanese Alps, which reach elevations of up to 3000 m, are thought to have uplifted since the Pliocene or Quaternary (Yonekura et al., 2001; Takahashi, 2006) in response to E–W compressional tectonic forces (Takahashi, 2006; Townend and Zoback, 2006; Sueoka et al., 2016). Lithology of the Hida range is dominated by granitic intrusions, including the Kurobegawa granite, which is the youngest known intrusion on Earth and which was emplaced between 10 and 0.8 Myr ago (Ito et al., 2013, 2017). Previous efforts to apply apatite fission-track dating on the Kurobegawa granite have been unsuccessful because of the very low fission-track density (Yamada, 1999). Extremely young apatite (0.50±0.04 Ma) and zircon helium ages (0.37±0.10 Ma) have recently been reported (Spencer et al., 2019), indicating that exhumation in this region has remained rapid throughout the Quaternary period.
Six bedrock samples were taken from the Kurobegawa granite in the northern Hida range of the Japanese Alps. Four surface samples were taken and form an elevation transect, whilst a further two samples were taken from a high-temperature tunnel, which has a present-day temperature of ∼40–50 ∘C but which had temperatures of up to 165 ∘C at the time of excavation in the late 1930s (Yuhara and Yamamoto, 1983). Samples had a minimum size of to ensure that a light safe portion could be extracted from their interiors. Sample details are given in the Supplement.
4.1 Sample preparation
Bedrock samples were prepared using standard laboratory methods under subdued red light conditions at the University of Lausanne and University of Bern, Switzerland (see King et al., 2016c). At least 10 mm was cut from the exterior of the samples using a water-cooled diamond saw to extract the light safe interior. A thin section was made using a representative sample of the bedrock exterior, and a further representative sample was sent to ActLabs, Canada, for ICP-MS analysis. Sample interiors were then hand crushed to extract the 180–212 µm grain size fraction, which was treated with HCl and H2O2 to remove any carbonates and organic material, respectively. The K-feldspar and quartz fractions were separated from heavy minerals using heavy liquids. The K-feldspars were retained for luminescence dating, whilst the quartz extracts ( g cm−3) were etched for 40 min using 40 % HF, before being treated with HCl to remove fluorides that had precipitated during etching. The etched samples were sieved to >150 µm to remove any partially dissolved feldspar grains. Aliquots for ESR measurement comprised 60 mg of quartz loaded into glass tubes with interior and exterior diameters of 2 and 3 mm, respectively.
4.2 Environmental dose rate determination
The grain size distribution of quartz and feldspar minerals within the parent bedrock was estimated from thin section analysis using the software of Buscombe (2013). The environmental dose rate, , was calculated from the sample-specific radioisotope concentrations using DRAC v.1.2 (Durcan et al., 2015), the conversion factors of Guérin et al. (2011), the alpha grain size attenuation factors of Bell (1980), and the beta grain size attenuation factors of Guérin et al. (2012). Because the bedrock samples have only been at the surface for a short period of time, no cosmic dose rate was included in the calculation. The water content was estimated at 2 %±2 %. For the quartz extract, an etch depth of 10 µm was assumed and the alpha dose rate adjusted following Bell (1980); an a value of 0.040±0.005 was used after Rees-Jones (1995) for any residual alpha dose. No internal dose rate was included. In contrast, the feldspar fraction was not etched, and an a value of 0.15±0.05 was used after Balescu and Lamothe (1994). An internal K content of 12.5 %±5.0 % was assumed following Huntley and Baril (1997). The calculated environmental dose rates are summarized in Table 1, and full calculation details are given in the Supplement.
4.3 Electron spin resonance
Electron spin resonance measurements were done at the Leibniz Institute for Applied Geophysics in Hanover, Germany. Measurements were made on a JEOL JES-FA100 spectrometer using 2.0 mW microwave power, 0.1 mT modulation width, a 333.5±15 mT magnetic field, 0.1 s time constant, and 60 s scan which was averaged over three scans. All spectra were measured three times following sample turning by 60∘ to avoid any anisotropic effects. Measurements were made at −150 ∘C. The instrumentation detailed in Oppermann and Tsukamoto (2015) was used to facilitate X-ray irradiation and sample preheating, which is described below. The Ti and Al centre peaks were fitted using V3.3.35 of the JEOL ESR data processing software and were normalized relative to the intensity of the sixth hyperfine line of Mn2+ from the internal MgO standard, doped with MnO. As our measurements were carried out at −150 ∘C, it was not possible to differentiate between the Ti–H and Ti–Li centres, and consequently they have been treated as a single centre (Fig. 2). All subsequent data fitting was done using MATLAB.
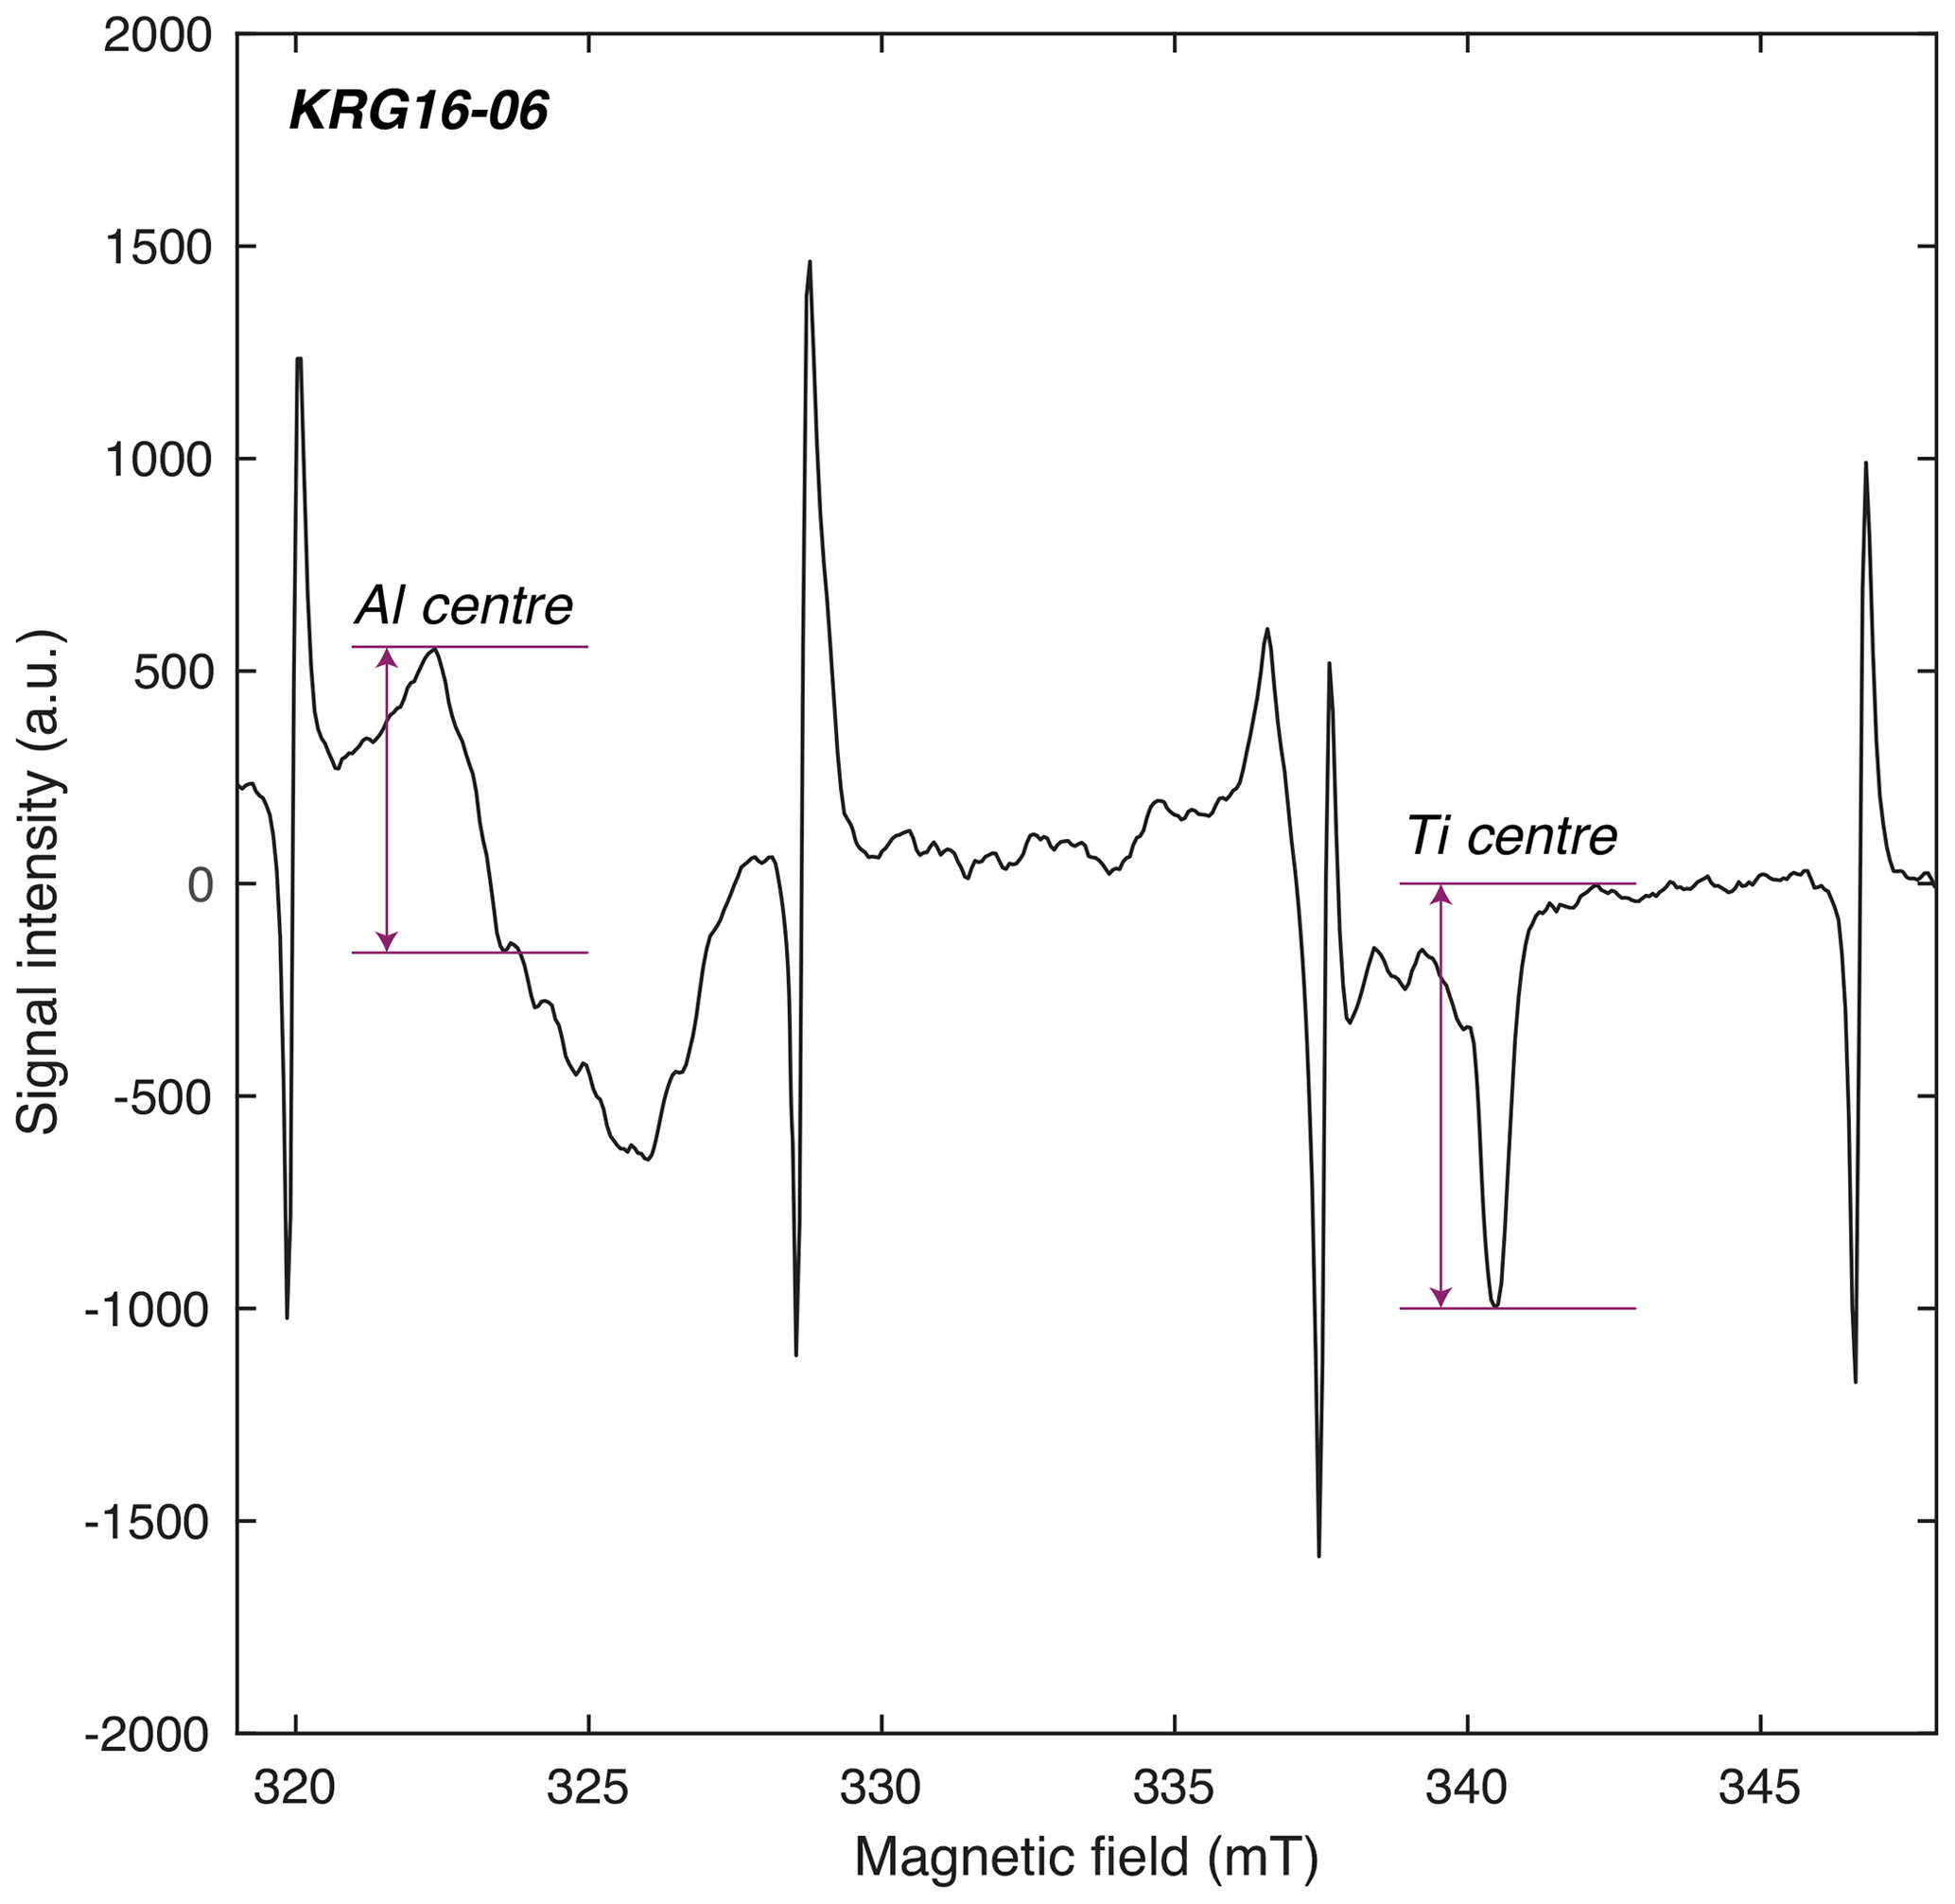
Figure 2Natural ESR spectrum of sample KRG16-06. The spectrum of the internal MgO:Mn standard overprints the quartz ESR spectrum but does not affect the Al and Ti centre integration ranges used (indicated on the figure).
4.3.1 Measurement protocol optimization
Tsukamoto et al. (2015, 2018) recently showed that it is necessary to preheat ESR samples that are measured in a single-aliquot protocol to avoid any signal contribution from trapped charge that is unstable over laboratory timescales, similar to luminescence dating (see Murray and Wintle, 2000). Within this study, a series of tests was done to select the most appropriate preheat temperature and duration. The signal intensities of five aliquots of samples KRG16-06 and KRG16-104 were measured following different preheat treatments (i.e. one aliquot per temperature; Fig. 3a). Aliquots of KRG16-06 were preheated for 2 min at temperatures between 160 and 240 ∘C, whereas aliquots of sample KRG16-104 were preheated for 4 min at temperatures between 120 and 200 ∘C. The signal intensity of a further aliquot of each sample was measured without laboratory preheating. In addition to measuring the ESR signal intensity, equivalent doses of the Ti and Al centres of KRG16-06 for each preheat temperature were measured in a single-aliquot method (Tsukamoto et al., 2015; Fig. 3b). The single-aliquot protocol comprised measurement of the natural signal, measurement of a single additive dose, annealing at 420 ∘C for 2 min and measurement following zero dose. All irradiation doses were given using an X-ray source with a dose rate of ∼0.3 Gy s−1 (Tsukamoto et al., 2018); aliquots were manually turned once during irradiation to ensure that even dosing was achieved.
4.3.2 Measurement of the trapped-charge concentration
The trapped-charge population of the different samples was measured using a single-aliquot approach. This comprised measurement of the natural signal, a zero-point measurement following annealing of the aliquot at 380 ∘C for 4 min, and measurement of two or three regenerative doses points. The natural signal was then interpolated onto the dose response curve to determine the equivalent dose; all equivalent dose values were calculated using a linear fit. To confirm that the measurement protocol was appropriate, a dose recovery experiment was done. Three aliquots of zero-age sample KRG16-112 were given an X-ray dose of 360 Gy, before measurement using the same protocol outlined above. Trapped-charge dating systems usually experience signal saturation; therefore, it is also necessary to constrain the form of ESR centre dose response. Using a new aliquot of each sample, dose response was measured using the same measurement protocol but omitting the zero-point measurement step, i.e. in an additive dose response protocol.
4.3.3 Measurement of trapped-charge thermal decay
Thermal signal losses were measured using an isothermal decay experiment, whereby three aliquots of each sample were irradiated with an additive dose of 4.30 k Gy. The aliquots were then preheated at 160 ∘C for 4 min prior to initial measurement and were then measured following isothermal holding between 130 and 180 ∘C for 4, 8, 16, 32, 64, 128, and 256 min. This experiment was also repeated on three fresh aliquots of sample KRG16-104 using a smaller dose of 2.15 k Gy.
4.4 OSL measurements
OSL measurements of all samples followed the approach of King et al. (2016b, c). Luminescence measurements were made at the University of Bern using a single-aliquot regenerative dose multiple-elevated-temperature (MET) infrared stimulated luminescence (IRSL) measurement protocol (Li and Li, 2011) comprising a preheat at 250 ∘C for 60 s, followed by four IRSL measurements at 50, 100, 150, and 225 ∘C each of 100 s duration. A test dose of 160 Gy was used, which is ca. 30 % of the IRSL50 signal equivalent dose value of samples KRG16-06, KRG16-101, and KRG16-104. Each measurement cycle was followed by a high-temperature optical wash at 290 ∘C for 60 s. Regenerative doses up to ∼4.50 k Gy were given to three small (2 mm diameter) aliquots of each sample using two different Risø TL-DA-20 luminescence readers with dose rates ranging from 0.06 to 0.10 Gy s−1 dependent on the instrument (dose rates are provided for each measurement in the Supplement). Luminescence signals were detected in the blue part of the visible spectrum using a BG39 and BG3 or Corning 7-59 filter combination. The suitability of the selected measurement protocol was confirmed using a dose recovery test.
Rates of athermal and thermal charge detrapping were also measured using a single-aliquot regenerative dose method on the same aliquots used to measure the luminescence dose response curve. Athermal detrapping rates were quantified at room temperature by measuring the luminescence response to a fixed dose following different delay periods. Aliquots were preheated prior to storage following Auclair et al. (2003), and maximum fading delays were 122 d. Rates of thermal charge detrapping were measured using isothermal holding experiments. The aliquots were given a dose of 50 Gy and held at temperatures ranging from 170 to 350 ∘C for delay times of 0 to 10 240 s prior to measurement.

Figure 3(a) Changing ESR signal intensity with increasing preheat temperature for KRG16-06 (2 min preheats) and KRG16-104 (4 min preheats). Signal intensities are normalized relative to measurements made following no preheating (shown at 20 ∘C). (b) Preheat plateau data for KRG16-06 based on measurement of a single aliquot at each temperature (2 min preheats).
5.1 Electron spin resonance
The signal intensity experiment indicates a plateau for the Ti centre of sample KRG16-104 up until 160 ∘C (Fig. 3a). In contrast, the Al centre for this sample and the Ti centre of sample KRG16-06 decrease in intensity by ∼5 % between room temperature and 160 ∘C, whilst the Al centre of sample KRG16-06 is depleted further, by ∼10 %. The signal intensity data for KRG16-06 are relatively noisy (non-monotonic signal decay with increasing preheat temperature) in comparison to KRG16-104. However, in spite of this, within the preheat plateau experiment (Fig. 3b), a plateau in De values between 160 and 220 ∘C is recorded for this sample following preheating for 2 min. On the basis of these experiments a preheat temperature of 160 ∘C was selected as this temperature maximizes signal intensity (Fig. 3a) whilst remaining within the De value plateau (Fig. 3b).
Preheating for short durations resulted in the heater unit overshooting the target temperature and poor thermal reproducibility. For this reason, a longer duration preheat at 160 ∘C for 4 min was selected for all measurements. This selected protocol is further validated by the successful recovery of a 360 Gy dose from naturally zero-age sample KRG16-112 for both the Al and Ti centres, which yield recovered-to-given dose ratios of 0.83±0.20 and 1.01±0.06, respectively (n=3).
Measurements of the trapped-charge population of the Al and Ti centres were similar between aliquots, resulting in 1σ uncertainties of ∼20 %. Equivalent dose values for the Al and Ti centres were within uncertainty for all samples, and ages ranged from 291±13 ka for sample KRG16-05 to 36±3 ka for sample KRG16-10 (Table 1). Samples KRG16-111 and KRG16-112 from the high-temperature tunnel yielded zero age; consequently, full dose response and isothermal decay was not measured for sample KRG16-112, and it is not included in Table 1. Whereas it was possible to saturate the Ti centre of all samples with the maximum given dose of 19 k Gy, the Al centre continued to grow linearly throughout measurement for all samples (Fig. 4a, c). Continued growth of the Al centre has been reported previously and has been accommodated through fitting dose response with an exponential plus linear function (e.g. Duval, 2012). In contrast, for the KRG samples, the Al centre is best described using a linear regression (Fig. 4a). The Ti centre of all samples showed a reduction in signal intensity at high doses (i.e. >10 k Gy), which has also been reported previously (e.g. Duval and Guilarte, 2015) and has been attributed to changing electron capture probabilities (Woda and Wagner, 2007). To characterize the maximum possible trapped-charge population we excluded data points at which the ESR signal intensity started to decrease (white data points in Fig. 4c) and fitted the remaining data with a single saturating exponential function (e.g. Grün and Rhodes, 1991) of the form
where I is the natural ESR signal intensity, Isat is the saturation intensity of the ESR signal, and D is the given dose (Gy). Because the Ti centre experiences saturation, the equivalent dose value, De, can also be expressed as a saturation ratio, i.e. . As only a single aliquot of each sample was dosed until saturation, values for the Ti centre were calculated from interpolation of the average De value (n=3) onto the single dose response curve; thus, values for the Ti centre are derived from multiple aliquots.
Toyoda and Ikeya (1991) suggested that the thermal decay of the E', Al, and Ti centres follows 2nd-order kinetics; however, it was not possible to fit our data using either a 1st- or 2nd-order kinetic model (Supplement). Instead, the isothermal decay data were fitted using a multiple 1st-order kinetic model (Lambert, 2018; Table 1). Whilst the actual physical meaning of a Gaussian distribution of energies requires further investigation within the context of ESR defects, and it is unlikely that both the Al and Ti centres follow exactly the same process of thermal decay, preliminary fits to the data using this model are promising (Fig. 4b, d). Values of μ(Et) ranged from 1.27 to 1.90 eV between samples and centres (Table 1).
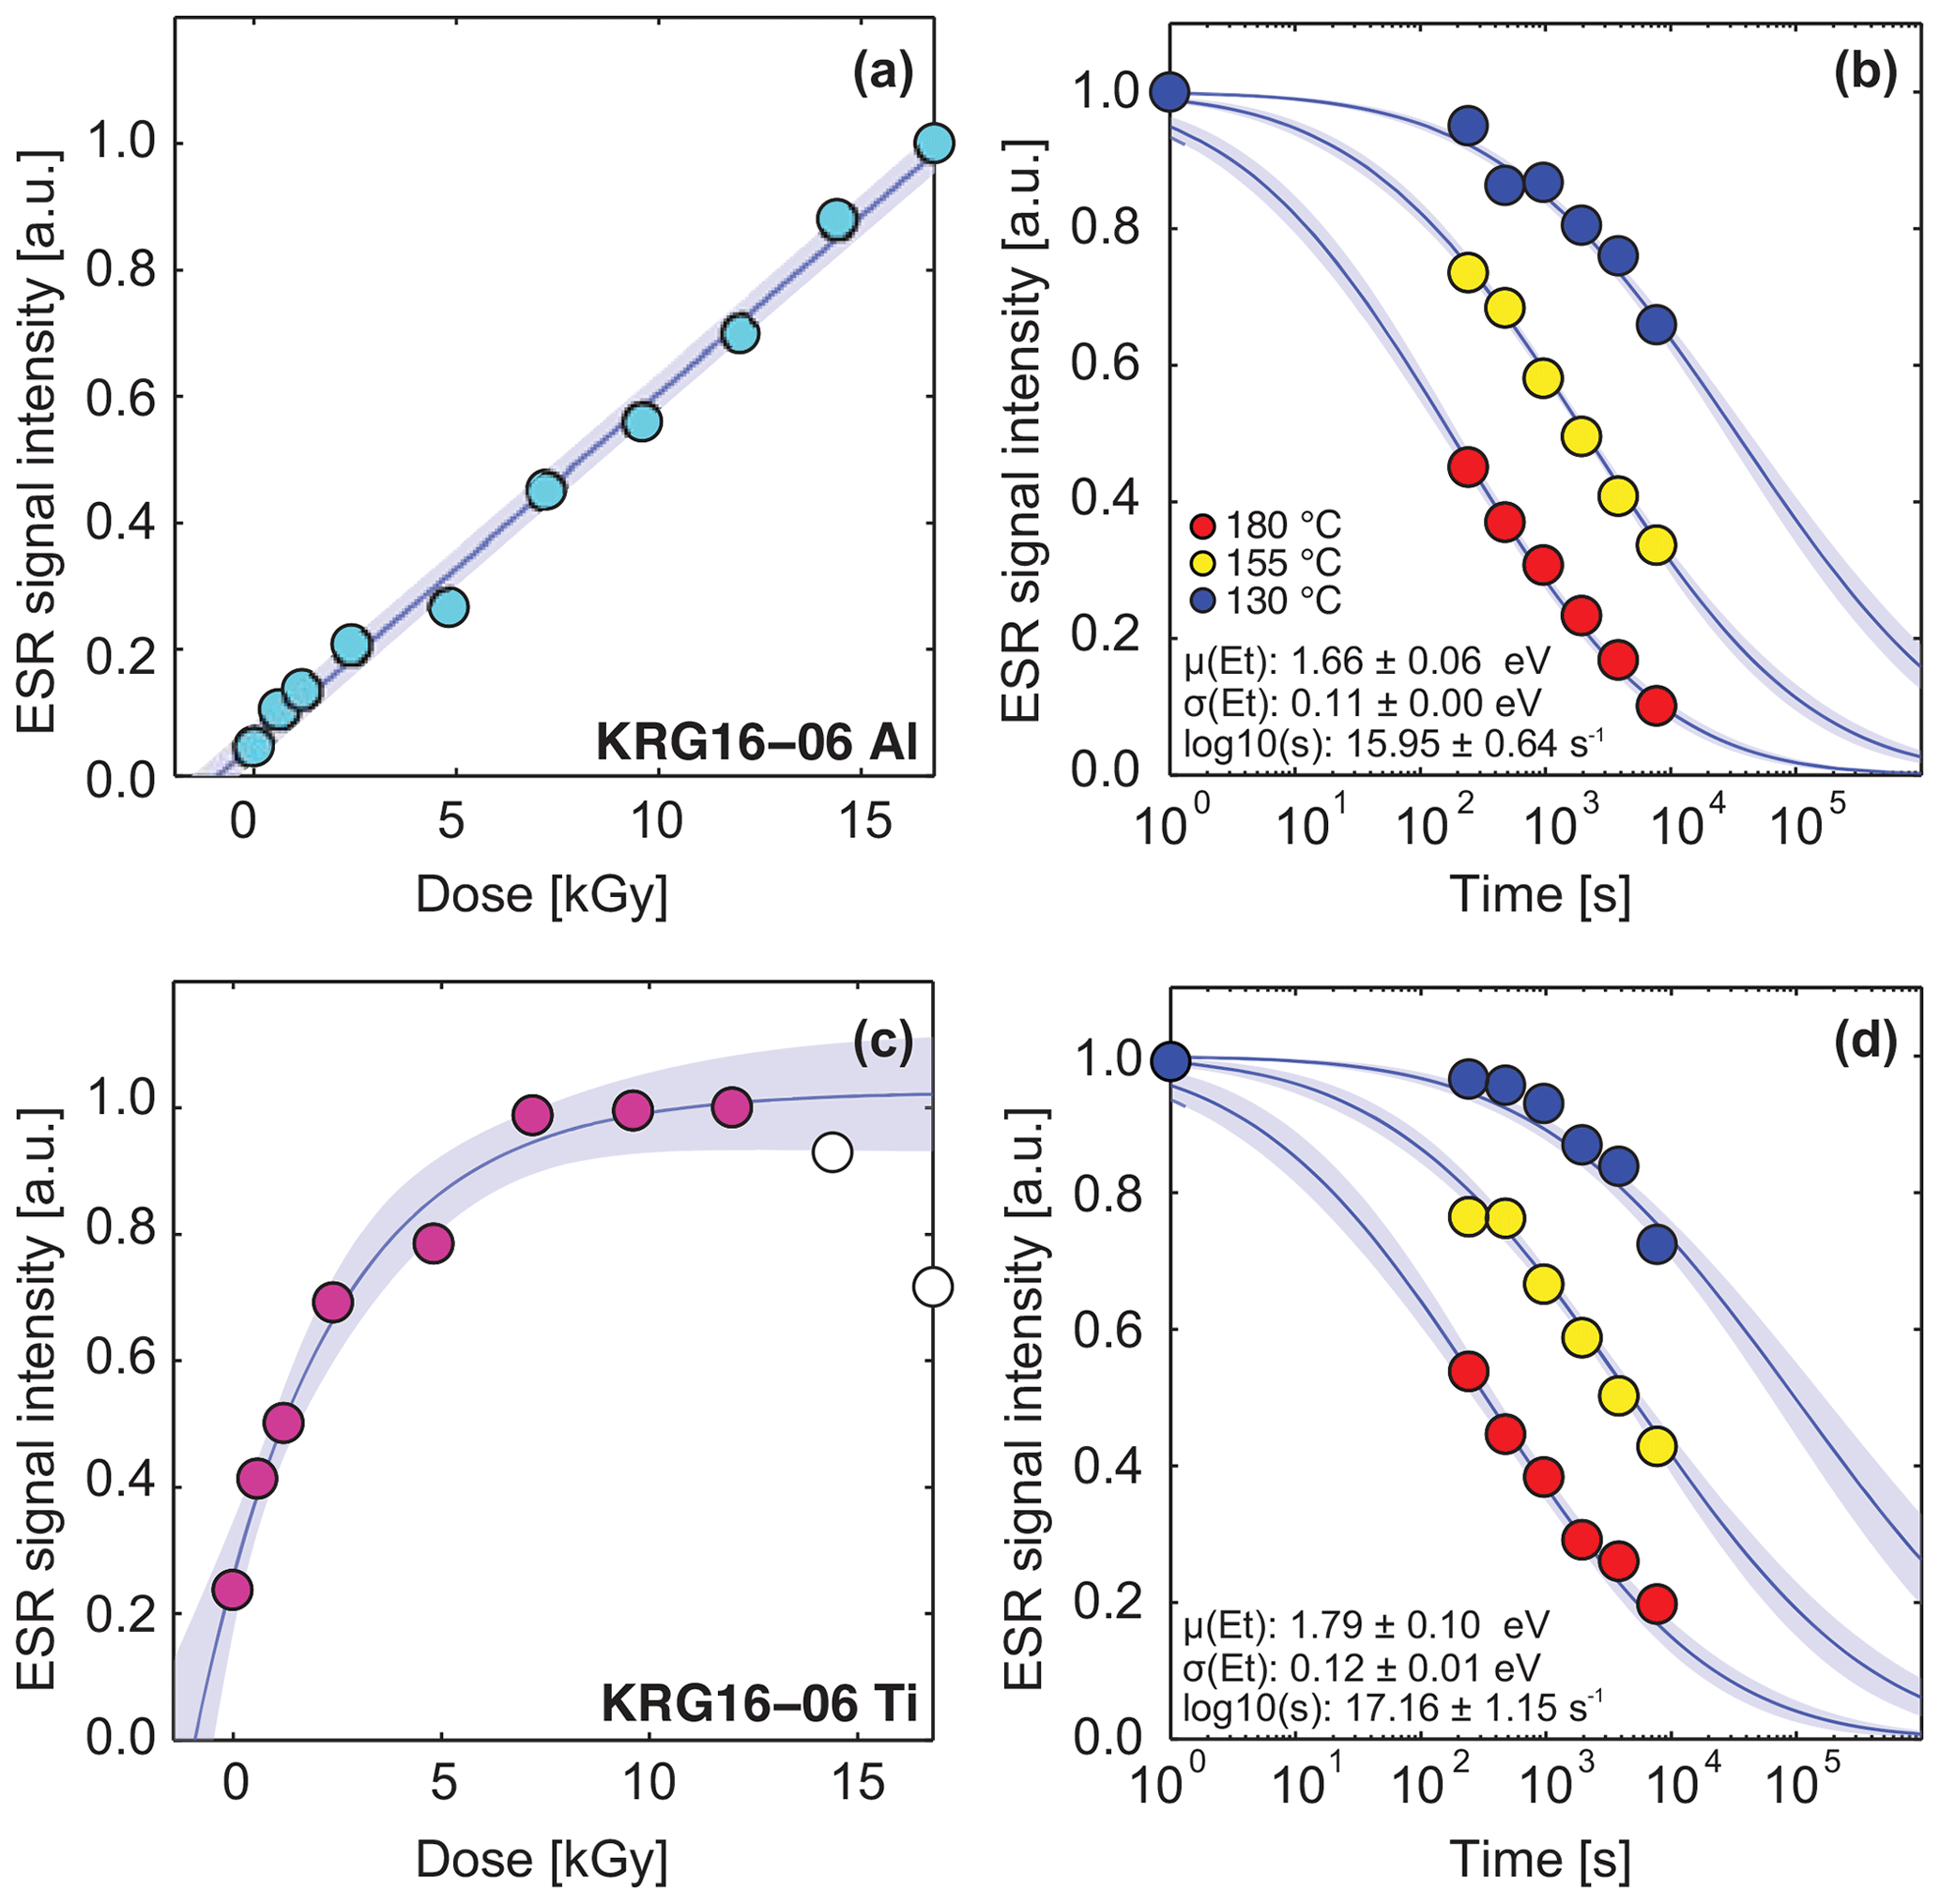
Figure 4ESR dose response and isothermal decay for the Al (a, b) and Ti centres (c, d) of sample KRG16-06. Whereas the Al centre (a) experiences linear signal accumulation, the Ti centre (b) follows exponential growth before the signal intensity starts to decrease (white data points). This reduction in signal intensity is thought to represent radiation dose quenching of the ESR signal (see Woda and Wagner, 2007; Tissoux et al., 2007; Duval and Guilarte, 2015), and these data were excluded before fitting. The isothermal decay of the Al (a) and Ti centres (b) is fitted with a density of states model assuming a Gaussian distribution around trap depth (Lambert, 2018).
5.2 Optically stimulated luminescence
For all of the samples, the measured luminescence signals fulfilled the acceptance criteria (see the Supplement for further details). The IRSL50 signals of all samples exhibited very high rates of fading, with g2 d values ranging from 6 % to 11 % decade−1, whereas for post-IR IRSL measurements at 225 ∘C, fading rates were 2 %–4 % decade−1. The model introduced by Huntley (2006) was used to fit the athermal detrapping data to determine ρ′. Using this model to fading-correct the trapped-charge concentrations following Kars et al. (2008) indicates that the IRSL50 signals of samples KRG16-06 and KRG16-101, and all signals for sample KRG16-05, are saturated (see the Supplement). All other signals can be used to determine rock cooling histories. Saturation of the IRSL50 signals relative to the higher-temperature signals is a consequence of their relatively high rate of anomalous fading. The luminescence dose response data for all of the samples and signals were fitted with a single saturating exponential fit to determine the characteristic dose of saturation, D0, and the concentration of trapped charge, . Although for some samples a general-order kinetic (GOK) model fit would result in lower deviation from the measured values, GOK fits have been shown to overestimate sample athermal field saturation values (King et al., 2018), which must be done accurately to evaluate if a sample contains thermal information (see Valla et al., 2016). Finally, the isothermal decay data were fitted using the band-tail states model (Poolton et al., 2009; Li and Li, 2013; Eqs. 5–7) to determine Et, Eu, and s. Values of Et ranged from 1.27 to 1.52 eV between samples and signals (Table 2).
Table 2Summary of sample luminescence kinetic parameters. Full details of the environmental dose rate derivation are given in the Supplement. Ages in italics are saturated. Maximum ages are calculated from 2*D0.
5.3 Inversion of ESR and OSL data for cooling histories
In order to invert the data into cooling histories, we used the same approach outlined in Sect. 3. We computed OSL and ESR dose response curves from 10 000 randomly generated t−T paths, which were constrained to cool monotonically between 200 ∘C and 15±5 ∘C over 2 Myr. Initially the Al centre, Ti centre, and OSL centres were inverted separately, before being inverted together. The results for all samples, with the exception of naturally zero-age samples KRG16-111 and KRG16-112, are shown in Fig. 5.
Figure 5Probability density functions of cooling histories inverted from the ESR and OSL data for samples KRG16-05, KRG16-06, KRG16-101, and KRG16-104. The different rows show inversion of the Al centre, the Ti centre, the Al and Ti centres together, all four OSL signals (i.e. IRSL50, IRSL100, IRSL150, IRSL225), and finally the Al, Ti, and OSL centres together. Time–temperature histories were generated over 2 Myr with random monotonic cooling from 200 ∘C to 15±5 ∘C. All probability density functions are scaled relative to 1. Model residuals for the inversion of all signals together are shown in the Supplement.
Trapped-charge thermochronometers offer benefits over other thermochronometry systems because of their low closure temperature and ability to yield precise cooling histories over Quaternary timescales (Herman and King, 2018). However, signal saturation has proven a significant barrier to the application of luminescence thermochronometry (see Valla et al., 2016). For ESR thermochronometry to offer a viable alternative it should exhibit later signal saturation but also similar thermal stability. The measurements presented here are promising because whilst the ages measured for the OSL and ESR systems are similar, the maximum possible ages that can be obtained from the ESR Ti centre are more than 4 times greater than the maximum possible age that can be obtained from the OSL signals (Tables 1 and 2). Furthermore, the Al centre of the KRG samples does not exhibit signal saturation up to 19 k Gy, which was the maximum dose explored in this study (Fig. 4a). Although such linear dose response behaviour has, to our knowledge, not been reported previously and thus may be a property of these exceptionally young quartz minerals, it is an exciting observation that warrants further study through the investigation of further quartz samples.
Samples KRG16-111 and KRG16-112 from the high-temperature tunnel yielded zero or near-zero ages for both ESR centres and the IRSL signals investigated (Tables 1 and 2). These samples provide an important local control on the thermal stability of these trapped-charge systems, demonstrating that all charge is evicted from the centres at sufficiently high temperatures. For the remaining samples, the ages obtained from the two ESR centres are within uncertainties, indicating that they may have similar thermal stability. For the OSL data, some variance in age is recorded between the different signals (Table 2); all signals of sample KRG16-05 are in field saturation, and thus only a minimum sample age of ∼180 ka can be calculated (Table 2). The IRSL50 signals of samples KRG16-06 and KRG16-101 are also in field saturation, yielding the highest apparent ages for these samples, and are not considered further. For samples KRG16-06 and KRG16-101, the remaining IRSL signals show a general reduction in age with increasing stimulation temperature, possibly indicating that the ages have been overcorrected for anomalous fading using the Huntley (2006) model (see King et al., 2018). The OSL and ESR ages of samples KRG16-06 and KRG16-104 are similar, indicating that for these samples the ESR and OSL signals have similar thermal stability and thus that ESR thermochronometry would also be suitable for resolving late-stage cooling histories. In contrast, sample KRG16-101 yields OSL ages twice as large as the ESR ages, which could be indicative of a difference in centre thermal stability.
To further evaluate the relative thermal stability of the ESR and OSL signals, the isothermal decay of the ESR and feldspar systems was simulated using the experimentally constrained kinetic parameters of the different samples for isothermal conditions of 20 ∘C assuming an initial trapped-charge concentration of 1 and assuming no charge trapping (Fig. 6). Note that anomalous fading-related signal loss has also been included for the OSL signals, as excluding this variable would result in erroneously high apparent signal stabilities. The ESR centres have similar thermal stability to the IRSL centres for all samples, with the exception of sample KRG16-101 (Fig. 6c), for which the ESR centres are more thermally stable. The Ti centre is more thermally stable than the Al centre for all samples, with the exception of sample KRG16-104 for the measurement in response to 2.15 k Gy. This is consistent with the earlier work of Grün et al. (1999), who also extracted quartz from granitic bedrock and observed that the Ti centre is more thermally stable than the Al centre, but contrasts with observations from Chinese loess (Tsukamoto et al., 2018). The contrasting behaviour between the two measurements of KRG16-104 in response to doses of 4.30 and 2.15 k Gy (Fig. 6d) reflects uncertainty in the derivation of ESR kinetic parameters, potentially related to inter-aliquot variability. Improved measurement protocols and the development of automated instrumentation may alleviate these discrepancies by improving measurement reproducibility; however, despite this, the thermal stability determined in both experiments is broadly similar (Fig. 6d). The general trend of ESR signals exhibiting similar thermal stability to IRSL signals indicates that ESR thermochronometry will record changes in exhumation histories from a similar thermal range as OSL thermochronometry, whilst benefitting from considerably later signal saturation and being unaffected by anomalous fading.
Figure 6Thermal stability of ESR signals in comparison to IRSL signals. The isothermal decay of (a) KRG16-05, (b) KRG16-06, (c) KRG16-101, (d) KRG16-104, and (e) KRG16-111 was modelled using the kinetic parameters listed in Tables 1 and 2 under isothermal conditions of 20 ∘C. Anomalous fading signal loss has been included in modelling of the IRSL data.
Inverting the Al and Ti centres of all samples results in broadly similar time–temperature histories between centres, whilst the cooling histories of different samples vary (Fig. 5). This is in agreement with the Al and Ti centre similar thermal stabilities (Fig. 6) and measured ages (Table 1). The two different centres can also be effectively combined to produce a single cooling history (Fig. 5), which is similar to that inverted from the OSL data alone for samples KRG16-101 and KRG16-104 (Fig. 5). For sample KRG16-05, the saturated OSL signals result in a broad cooling history, whereas for sample KRG16-06 the OSL data yield more rapid cooling than the ESR data. The OSL and ESR data can also be inverted together. These data show that for samples beyond the range of OSL dating, ESR thermochronometry will be able to provide cooling histories over a similar thermal range, allowing late stage exhumation histories to be determined. The data inversions reveal that rates of rock cooling in the Hida range of the Japanese Alps are consistent with previous investigations that indicate rapid rock cooling (Ito et al., 2013, 2017; Spencer et al., 2019). Whereas sample KRG16-05 experienced almost no cooling over the past 2 Myr, cooling rates accelerated from ∼100 ∘C Myr−1 (calculated from the U/Pb ages of Ito et al., 2013) to rates of >400 ∘C Myr−1 over the past 100 kyr for samples KRG16-06, KRG16-101, and KRG16-104.
In this study, the potential of ESR thermochronometry for constraining rates of rock cooling has been explored for a suite of samples from the Hida range of the Japanese Alps. By using the latest ESR measurement protocols (Tsukamoto et al., 2015) and instrumentation (Oppermann and Tsukamoto, 2015), the dose response and thermal stability of both the Al and Ti centres have been constrained. Whilst the Ti centre can be described with a single saturating dose response curve, the Al centre continues to grow linearly with laboratory irradiation. A multiple 1st-order model based on a distribution of trap depths was successfully used to fit isothermal decay data (Lambert, 2018), which do not follow either simple 1st-order or 2nd-order decay. Contrasting the thermal stability of the Al and Ti centres with that of the luminescence centres of feldspar shows that the ESR of quartz has similar thermal stability. The Al and Ti centres can be successfully inverted together for rock cooling for all of the samples investigated. It was also possible to invert the OSL and ESR data together for all samples analysed, providing further constraints on their thermal histories. Whereas OSL thermochronometry of sample KRG16-06 can only recover a minimum cooling rate of ∼160 ∘C Myr−1, both ESR centres have the potential to recover cooling rates as low as 50–25 ∘C Myr−1, illustrating the potential of ESR for resolving late-stage cooling histories.
Raw data for this study are available at https://doi.org/10.5281/zenodo.3548747 (King et al., 2019).
The supplement related to this article is available online at: https://doi.org/10.5194/gchron-2-1-2020-supplement.
GK conceived the study together with input from FH, SS, TT, and ST. GK, FH, SS, TT, and ST collected the samples. GK carried out the sample preparation and measurement with input from ST. GK, FH, and RB developed the numerical modelling approach for the data. GK wrote the paper with input from all co-authors.
The authors declare that they have no conflict of interest.
Georgina E. King acknowledges financial support through a Mobility Grant from the University of Cologne that funded initial fieldwork. We thank the Chubu Regional Environment Office for permission to collect rocks in the Chubu Sangaku National Park. Sample collection was supported by the Kansai Electric Power Co., Inc., Yasuhisa Hino (KANSO Co., Ltd.), Tetsuya Komatsu (JAEA), Shuji Terusawa (OYO Co., Ltd.), Shoma Fukuda, Takayuki Arai (Kyoto Univ.), and the staff of the Azohara lodge. The Herbette Foundation funded Sumiko Tsukamoto to stay at the University of Lausanne during the study. Benny Guralnik is thanked for commenting on an earlier version of this paper.
This research has been supported by the Swiss National Science Foundation (grant no. PZ00P2_167960) and the Grant-in-Aid for Scientific Research on Innovative Areas from the Ministry of Education, Culture, Sports, Science and Technology (MEXT) (grant no. KAKENHI 26109003).
This paper was edited by James Feathers and reviewed by Nathan Brown and one anonymous referee.
Auclair, M., Lamothe, M., and Huot, S.: Measurement of anomalous fading for feldspar IRSL using SAR, Rad. Meas., 37, 487–492, https://doi.org/10.1016/S1350-4487(03)00018-0, 2003.
Balescu, S. and Lamothe, M.: Comparison of TL and IRSL age estimates of feldspar coarse grains from waterlain sediments, Quaternary Sci. Rev., 13, 437–444, https://doi.org/10.1016/0277-3791(94)90056-6, 1994.
Bell, W. T.: Alpha dose attenuation in quartz grains for thermoluminescence dating, Anc. Tl, 12, 4–8, 1980.
Biswas, R., Herman, F., King, G. E., and Braun, J.: Thermoluminescence of feldspar as a multi-thermochronometer to constrain the temporal variation of rock exhumation in the recent past, Earth Planet Sci. Lett., 495, 56–68, https://doi.org/10.1016/j.epsl.2018.04.030, 2018.
Buscombe, D.: Transferable wavelet method for grain-size distribution from images of sediment surfaces and thin sections, and other natural granular patterns, Sedimentology, 60, 1709–1732, https://doi.org/10.1016/j.sedgeo.2008.06.007, 2013.
Coyle, D. A., Wagner, G. A., Hejl, E., Brown, R., and Van den Haute, P.: The Cretaceous and younger thermal history of the KTB site (Germany): apatite fission-track data from the Vorbohrung, Geol. Rundschau, 86, 203–209, https://doi.org/10.1007/s005310050132, 1997.
Durcan, J. A., King, G. E., and Duller, G. A. T.: DRAC: Dose Rate and Age Calculator for trapped charge dating, Quaternary Geochr., 28, 54–61, https://doi.org/10.1016/j.quageo.2015.03.012, 2015.
Duval, M.: Dose response curve of the ESR signal of the Aluminum center in quartz grains extracted from sediment, Anc. TL, 30, 41–49, 2012.
Duval, M. and Guilarte, V.: ESR dosimetry of optically bleached quartz grains extracted from Plio-Quaternary sediment: evaluating some key aspects of the ESR signals associated to the Ti-centers, Rad. Meas., 78, 28–41, https://doi.org/10.1016/j.radmeas.2014.10.002, 2015.
Grün, R.: Electron spin resonance (ESR) dating, Quternary Int., 1, 65–109, https://doi.org/10.1016/1040-6182(89)90010-4, 1989.
Grün, R. and Rhodes, E. J.: On the selection of dose points for saturating exponential ESR/TL dose response curves, Anc. TL 9, 40–46, 1991.
Grün, R., Tani, A., Gurbanov, A., Koshchug, D., Williams, I., and Braun, J.: A new method for the estimation of cooling and denudation rates using paramagnetic centers in quartz: A case study on the Eldzhurtinskiy Granite, Caucasus, J. Geophys. Res.-Solid Earth, 104, 17531–17549, https://doi.org/10.1029/1999JB900173, 1999.
Guérin, G., Mercier, N., and Adamiec, G.: Dose-rate conversion factors: update, Anc. TL, 29, 5–8, 2011.
Guérin, G., Mercier, N., Nathan, R., Adamiec, G., and Lefrais, Y.: On the use of the infinite matrix assumption and associated concepts: a critical review, Rad. Meas., 47, 778–785, https://doi.org/10.1016/j.radmeas.2012.04.004, 2012.
Guralnik, B., Jain, M., Herman, F., Ankjærgaard, C., Murray, A. S., Valla, P. G., Preusser, F., King, G. E., Chen, R., Lowick, S. E., Kook, M., and Rhodes, E. J.: OSL-thermochronology of feldspar from the KTB borehole, Germany, Earth Planet Sci. Lett. 423, 232–243, https://doi.org/10.1016/j.epsl.2015.04.032, 2015.
Herman, F. and King, G. E.: Luminescence Thermochronometry: Investigating the Link between Mountain Erosion, Tectonics and Climate, Elements, 14, 33–38, https://doi.org/10.2138/gselements.14.1.33, 2018.
Herman, F., Rhodes, E. J., Braun, J., and Heiniger, L.: Uniform erosion rates and relief amplitude during glacial cycles in the Southern Alps of New Zealand, as revealed from OSL-thermochronology, Earth Planet Sci. Lett. 297, 183–189, https://doi.org/10.1016/j.epsl.2010.06.019, 2010.
Huntley, D. J.: An explanation of the power-law decay of luminescence, J. Phys.: Cond. Mat., 18, 1359–1365, https://doi.org/10.1088/0953-8984/18/4/020, 2006.
Huntley, D. J. and Baril, M. R.: The K content of the K-feldspars being measured in optical dating or in thermoluminescence dating, Anc. TL, 15, 11–13, 1997.
Ikeya, M.: ESR studies of geothermal boring cores at Hachobara power station, Japanese J. Appl. Phys., 22, p. L763, https://doi.org/10.1143/JJAP.22.L763, 1983.
Ikeya, M.: New applications of electron spin resonance: dating, dosimetry and microscopy, World Scientific, 1993.
Isoya, J., Weil, J. A., and Davis, P. H.: EPR of atomic hydrogen 1H and 2H in α-quartz, J. Phys. Chem. Solids, 44, 335–343, https://doi.org/10.1016/0022-3697(83)90102-6, 1983.
Ito, H., Yamada, R., Tamura, A., Arai, S., Horie, K., and Hokada, T.: Earth's youngest exposed granite and its tectonic implications: the 10–0.8 Ma Kurobegawa Granite, Sci. Rep., 3, 1306, https://doi.org/10.1038/srep01306, 2013.
Ito, H., Spencer, C. J., Danišík, M., and Hoiland, C. W.: Magmatic tempo of Earth's youngest exposed plutons as revealed by detrital zircon U-Pb geochronology, Sci. Rep., 7, 12457, https://doi.org/10.1038/s41598-017-12790-w, 2017.
Kars, R. H., Wallinga, J., and Cohen, K. M.: A new approach towards anomalous fading-correction for feldspar IRSL dating-tests on samples in field saturation, Rad. Meas., 43, 786–790, https://doi.org/10.1016/j.radmeas.2008.01.021, 2008.
King, G. E., Guralnik, B., Valla, P. G., and Herman, F.: Trapped-charge thermochronometry and thermometry: A status review, Chem. Geol., 446, 3–17, https://doi.org/10.1016/j.chemgeo.2016.08.023, 2016a.
King, G. E., Herman, F., and Guralnik, B.: Northward migration of the eastern Himalayan syntaxis revealed by OSL thermochronometry, Science, 353, 800–804, 10.1126/science.aaf2637, 2016b.
King, G. E., Herman, F., Lambert, R., Valla, P. G., and Guralnik, B.: Multi-OSL-thermochronometry of feldspar, Quaternary Geochr., 33, 76–87, https://doi.org/10.1016/j.quageo.2016.01.004, 2016c.
King, G. E., Burow, C., Roberts, H. M. R., and Pearce, N. J. P.: Age determination using feldspar: evaluating fading-correction model performance, Rad. Meas., 119, 55–73, https://doi.org/10.1016/j.radmeas.2018.07.013, 2018.
King, G. E., Tsukamoto, S., Herman, F., Biswas, R. H., Sueoka, S., and Tagami, T.: ESR-thermochronometry of the Hida range of the Japanese Alps: Validation and future potential, Data set, Geochronology, Zenodo, https://doi.org/10.5281/zenodo.3548747, 2019.
Lambert, R.: Investigating thermal decay in K-feldspar for the application of IRSL thermochronometry on the Mont Blanc massif, Unpublished PhD Thesis, University of Lausanne, Switzerland, 2018.
Li, B. and Li, S. H.: Luminescence dating of K-feldspar from sediments: a protocol without anomalous fading correction, Quaternary Geochr., 6, 468–479, https://doi.org/10.1016/j.quageo.2011.05.001, 2011.
Li, B. and Li, S. H.: The effect of band-tail states on the thermal stability of the infrared stimulated luminescence from K-feldspar, J. Lum., 136, 5–10, https://doi.org/10.1016/j.jlumin.2012.08.043, 2013.
Murray, A. S. and Wintle, A. G.: Luminescence dating of quartz using an improved single-aliquot regenerative-dose protocol, Rad. Meas. 32, 57–73, https://doi.org/10.1016/S1350-4487(99)00253-X, 2000.
Nuttall, R. H. D. and Weil, J. A.: The magnetic properties of the oxygen–hole aluminum centers in crystalline SiO2. I.[AlO4]o, Can. J. Phys., 59, 1696–1708, https://doi.org/10.1139/p81-249, 1981.
Oppermann, F. and Tsukamoto, S.: A portable system of X-ray irradiation and heating for electron spin resonance (ESR) dating, Anc. TL, 33, 11–15, 2015.
Poolton, N. R. J., Kars, R. H., Wallinga, J., and Bos, A. J. J.: Direct evidence for the participation of band-tails and excited-state tunnelling in the luminescence of irradiated feldspars, J. Phys.: Cond. Mat., 21, 485505, https://doi.org/10.1088/0953-8984/21/48/485505, 2009.
Press, W. H.: Numerical Recipes 3rd Edition: the Art of Scientific Computing, Cambridge University Press, 2007.
Rees-Jones, J.: Optical dating of young sediments using fine-grain quartz, Anc. TL, 13, 9–14, 1995.
Richter, M., Tsukamoto, S., and Long, H.: ESR dating of Chinese loess using the quartz Ti centre: A comparison with independent age control, Quaternary Int., https://doi.org/10.1016/j.quaint.2019.04.003, in press, 2019.
Rink, W. J.: Electron spin resonance (ESR) dating and ESR applications in Quaternary science and archaeometry, Rad. Meas., 27, 975–1025, https://doi.org/10.1016/S1350-4487(97)00219-9, 1997.
Rinneberg, H. and Weil, J. A.: EPR Studies of Ti3+-H+ Centers in X-Irradiated α-Quartz, The J. Chem. Phys., 56, 2019–2028, https://doi.org/10.1063/1.1677493, 1972.
Scherer, T., Agel, A., and Hafner S. S.: Determination of uplift rates using ESR investigations of quartz, KTB Rep. 93-2. Kontinentales Tiefbohrprogram der Bundesrepublic Deutschland Niedersächs. Landesamt Bodenforsch., Hannover, 121–124, 1993.
Scherer, T., Plötze, M., and Hafner, S. S.: Paramagnetic defects of quartz in KTB and a drilling profile from Eldzhurtinskiy Granite, Russia. KTB Rep. 94-2. B25, Kontinentales Tiefbohrprogram der Bundesrepublic Deutschland Niedersächs, Landesamt Bodenforsch., Hannover, 1994.
Spencer, C. J., Danišík, M., Ito, H., Hoiland, C., Tapster, S., Jeon, H., McDonald, B., and Evans, N. J.: Rapid exhumation of Earth's youngest exposed granites driven by subduction of an oceanic arc, Geophys. Res. Lett., 46, 1259–1267, https://doi.org/10.1029/2018GL080579, 2019.
Sueoka, S., Tsutsumi, H., and Tagami, T.: New approach to resolve the amount of Quaternary uplift and associated denudation of the mountain ranges in the Japanese Islands, Geosc. Fron., 7, 197–210, https://doi.org/10.1016/j.gsf.2015.06.005, 2016.
Tachiya, M. and Mozumder, A.: Decay of trapped electrons by tunnelling to scavenger molecules in low temperature glasses, Chem. Phys. Lett. 28, 87–89, 1974.
Takahashi, M.: Tectonic Development of the Japanese Islands Controlled by Philippine Sea Plate Motion, J. of Geography (Chigaku Zasshi) 115, 116–123, https://doi.org/10.1016/0009-2614(74)80022-9, 2006 (in Japanese with English Abstract).
Tissoux, H., Falguères, C., Voinchet, P., Toyoda, S., Bahain, J. J., and Despriée, J.: Potential use of Ti-center in ESR dating of fluvial sediment, Quaternary Geochr., 2, 367–372, https://doi.org/10.1016/j.quageo.2006.04.006, 2007.
Townend, J. and Zoback, M. D.: Stress, strain, and mountain building in central Japan, J. Geophys. Res.-Solid Earth (1978–2012), 111, B03411, https://doi.org/10.1029/2005JB003759, 2006.
Toyoda, S. and Ikeya, M.: Thermal stabilities of paramagnetic defect and impurity centers in quartz: Basis for ESR dating of thermal history, Geoch. J., 25, 437–445, https://doi.org/10.2343/geochemj.25.437, 1991.
Tsukamoto, S., Toyoda, S., Tani, A., and Oppermann, F.: Single aliquot regenerative dose method for ESR dating using X-ray irradiation and preheat, Rad. Meas., 81, 9–15, https://doi.org/10.1016/j.radmeas.2015.01.018, 2015.
Tsukamoto, S., Long, H., Richter, M., Li, Y., King, G.E., He, Z., Yang, L., Zhang, J., and Lambert, R.: Quartz natural and laboratory ESR dose response curves: A first attempt from Chinese loess, Rad. Meas., 120, 137–142, https://doi.org/10.1016/j.radmeas.2018.09.008, 2018.
Valla, P. G., Lowick, S. E., Herman, F., Champagnac, J. D., Steer, P., and Guralnik, B.: Exploring IRSL50 fading variability in bedrock feldspars and implications for OSL thermochronometry, Quaternary Geoch., 36, 55–66, https://doi.org/10.1016/j.quageo.2016.08.004, 2016.
Wheelock, B., Constable, S., and Key, K.: The advantages of logarithmically scaled data for electromagnetic inversion, Geophys. J. Int., 201, 1765–1780, https://doi.org/10.1093/gji/ggv107, 2015.
Woda, C. and Wagner, G. A.: Non-monotonic dose dependence of the Ge-and Ti-centres in quartz, Rad. Meas., 42, 1441–1452, https://doi.org/10.1016/j.radmeas.2007.03.003, 2007.
Yamada, R.: Cooling history analysis of granitic rock in the Northern Alps, central Japan, The Earth Monthly, 21, 803–810, 1999 (in Japanese).
Yonekura, N., Kaizuga, S., Nogami, M., and Chinzei, K.: Introduction to Japanese geomorphology, University of Tokyo Press, Tokyo, 2001 (in Japanese).
Yuhara, K. and Yamamoto, T.: Thermal Effect of Water Flowing through Fractures on the Cooling of Kurobe Jobu Railway Tunnel (Hot Tunnel), Central Japan, J. Geothermal Res. Soc. of Japan, 5, 259–276, 1983.
- Abstract
- Introduction
- Theoretical basis
- Assessing the potential of ESR thermochronometry
- Proof of concept – Hida range, Japanese Alps
- Results
- Discussion
- Conclusions and outlook
- Data availability
- Author contributions
- Competing interests
- Acknowledgements
- Financial support
- Review statement
- References
- Supplement